Laravel 9 Highchart Donut Chart Example
May 03, 2022 . Admin
Hi Guys,
In this blog, I will show you how to draw donut chart in laravel 9. We will generate the simplest donut chart with Highcharts in laravel 9. i am going to learn you how to create donut chart highchart example with laravel 9. We will talk about laravel 9 highcharts donut chart example.
Highcharts is a one type js library, that provide to populate bar chart, line chart, area chart, column chart etc. Highcharts library also provide several theme and graphic design that way you can make better layout. Highcharts is a very popular and simple library for php developer.
In this post, we are learn how to implement simple dynamic donut highcharts laravel 9 example. I will give you full example of donut highcharts.
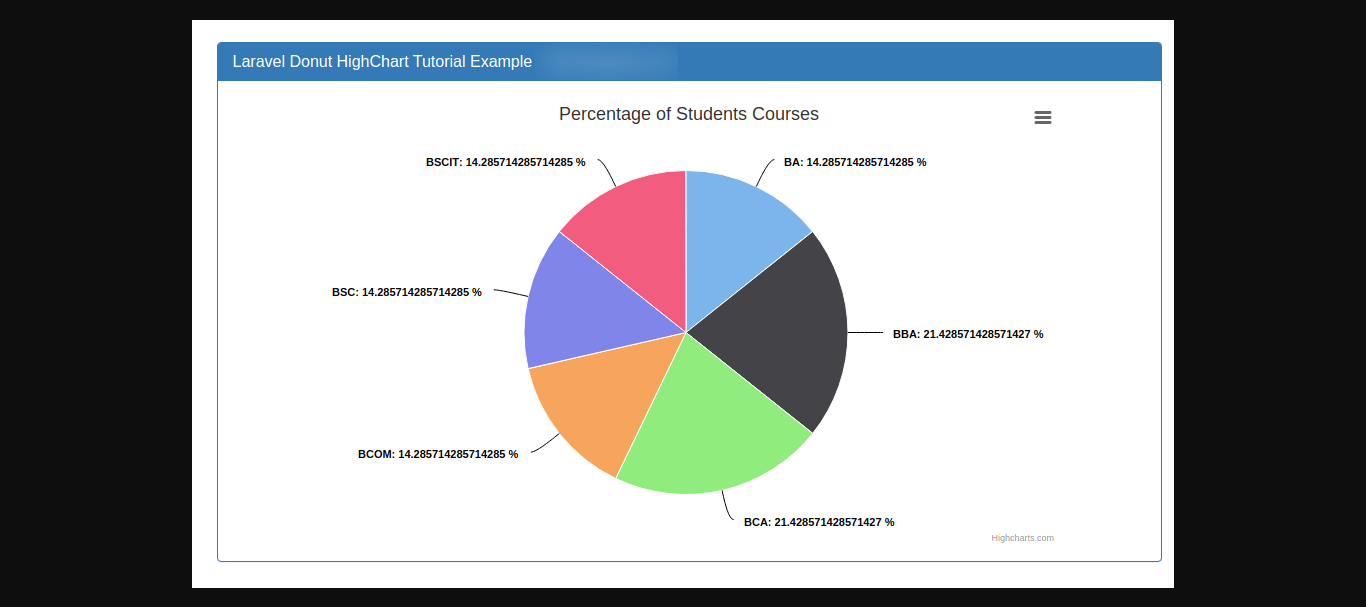
In this three step, we will create one tables with some dummy data and represent in donut chart. After complete this example you will find layout of donut Highcharts is looks like as above image, it's pretty nice, i think:
Here i will give you full example for highcharts donut chart in laravel 9. So let's see the bellow example:
Step 1: Download LaravelLet us begin the tutorial by installing a new laravel application. if you have already created the project, then skip following step.
composer create-project laravel/laravel example-appStep 2: Setup Database
After successfully install laravel 9 Application, Go to your project .env file and set up database credential and move next step :
.envDB_CONNECTION=mysql DB_HOST=127.0.0.1 DB_PORT=3306 DB_DATABASE=here your database name DB_USERNAME=here database username DB_PASSWORD=here database passwordStep 3: Create Migration and Model
In first step we have to create migration for students tables using Laravel php artisan command, so first fire bellow command:
php artisan make:migration create_students_table
After this command you will find one file in following path database/migrations and you have to put bellow code in your migration file for create tables.
database/migrations/2021_01_06_101902_create_students_table.php
<?php

use Illuminate\Database\Migrations\Migration;
use Illuminate\Database\Schema\Blueprint;
use Illuminate\Support\Facades\Schema;

class CreateStudentsTable extends Migration
{
    /**
     * Run the migrations.
     *
     * @return void
     */
    public function up()
    {
        Schema::create('students', function (Blueprint $table) {
            $table->id();
            $table->string('name');
            $table->string('course');
            $table->timestamps();
        });
    }

    /**
     * Reverse the migrations.
     *
     * @return void
     */
    public function down()
    {
        Schema::dropIfExists('students');
    }
}
Now we require to run migration be bellow command:
php artisan migrate
Now you can create student model for using laravel php artisan command So let's run bellow command one by one:
php artisan make:model Student
Now open model file and put the bellow code:
app/Models/Student.php
<?php

namespace App\Models;

use Illuminate\Database\Eloquent\Factories\HasFactory;
use Illuminate\Database\Eloquent\Model;

class Student extends Model
{
    use HasFactory;

    /**
     * The attributes that are mass assignable.
     *
     * @var array
     */
    protected $fillable = [
        'name','course'
    ];
}
Step 4: Create Route
first of all we will create simple route for creating simple donut chart. so let's add simple routes as like bellow:
routes/web.php
<?php

use App\Http\Controllers\HighChartController;

/*
|--------------------------------------------------------------------------
| Web Routes
|--------------------------------------------------------------------------
|
| Here is where you can register web routes for your application. These
| routes are loaded by the RouteServiceProvider within a group which
| contains the "web" middleware group. Now create something great!
|
*/

Route::get('donut-chart',[HighChartController::class,'donutChart']);
Step 5: Create Controller
php artisan make:controller HighChartController
Here, we will create new controller as HighChartController. so let's add bellow code on that controller file.
app\Http\Controllers\HighChartController
<?php

namespace App\Http\Controllers;

use Illuminate\Http\Request;
use App\Models\Student;

class HighChartController extends Controller
{
    /**
     * Write code on Method
     *
     * @return response()
     */
    public function donutChart()
    {
        $students = Student::select('course', \DB::raw("COUNT('id') as count"))
                ->groupBy('course')
                ->get();

        return view('donutChart', compact('students'));
    }
}
Step 6: Create View file
Here, we need to create blade file and in this blade file we use highchart js and use their code.
resources/views/donutChart.blade.php
<!DOCTYPE html>
<html>
<head>
    <title>Make Donut HighChart in Laravel 9</title>
    <script src="https://ajax.googleapis.com/ajax/libs/jquery/3.1.0/jquery.min.js"></script>
    <link rel="stylesheet" href="https://maxcdn.bootstrapcdn.com/bootstrap/3.3.6/css/bootstrap.min.css" />
    <style type="text/css">
        .box{
            width:800px;
            margin:0 auto;
        }
    </style>
</head>
<body>
    <div class="container" style="margin-top: 50px;">
        <div class="row">
            <div class="col-md-10 col-md-offset-1">
                <div class="panel panel-primary">
                    <div class="panel-heading">
                        <h3 class="panel-title">Laravel 9 Donut HighChart Tutorial Example - Mywebtuts.com</h3>
                    </div>
                    <div class="panel-body" align="center">
                        <div id="pie_chart" style="width:750px; height:450px;">
                        </div>
                    </div>
                </div>
            </div>
        </div>
    </div>
    <script src="http://code.highcharts.com/highcharts.js"></script>
    <script src="http://code.highcharts.com/modules/exporting.js"></script>
    <script type="text/javascript">
        $(document).ready(function() {
            var students =  <?php echo json_encode($students); ?>;
            var options = {
                chart: {
                    renderTo: 'pie_chart',
                    plotBackgroundColor: null,
                    plotBorderWidth: null,
                    plotShadow: false
                },
                title: {
                    text: 'Percentage of Students Courses'
                },
                 tooltip: {
                    pointFormat: '{series.name}: <b>{point.percentage}%</b>',
                    percentageDecimals: 1
                },
                plotOptions: {
                    pie: {
                        allowPointSelect: true,
                        cursor: 'pointer',
                            dataLabels: {
                            enabled: true,
                            color: '#000000',
                            connectorColor: '#000000',
                            formatter: function() {
                                return '<b>'+ this.point.name +'</b>: '+ this.percentage +' %';
                            }
                        }
                    }
                },
                series: [{
                    type:'pie',
                    name:'Student'
                }]
            }
            myarray = [];
            $.each(students, function(index, val) {
                myarray[index] = [val.course, val.count];
            });
            options.series[0].data = myarray;
            chart = new Highcharts.Chart(options);

        });
    </script>
</body>
</html>
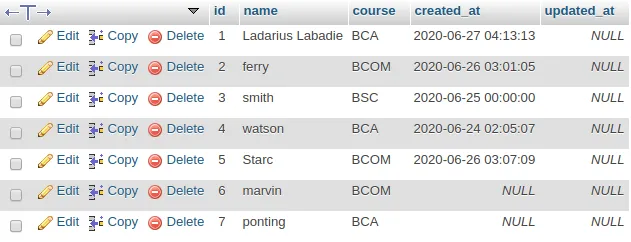
Step 7: Create Dummy Records:
Here, we need to add some dummy records on students table as course wise. You need to create students data as like bellow screen shot.
 Run Laravel App:
All steps have been done, now you have to type the given command and hit enter to run the laravel app:
php artisan serve
Now, you have to open web browser, type the given URL and view the app output:
http://localhost:8000/donut-chart
It will help you...