Laravel 8 Highcharts Example For Beginner
Jun 22, 2021 . Admin
Hi Dev,
Today, in this article i will explain how to create highchart in laravel 8 application. In this article i will show you highchart in laravel 8. We will learn how to integrate highchart in laravel 8. let's talk about how to utilize highchart in laravel 8.
Here i will give you simple and easy way to utilize highchart in laravel 8. In this example i am going to show month in total user count with highchart in laravel 8.
Highcharts is a js library, this library through we can use bar chart, line chart, area chart, column chart etc. Highcharts is a open source chart library. Highcharts also provide sevral theme and graph that way you can use more chart ypu from highchart documentation.
Now let's see bellow full example highchart in laravel 8. So let's follow bellow step by step:
Step 1: Install Laravel ProjectFirst, you require to download the laravel fresh setup. Use this command then download laravel project setup :
composer create-project --prefer-dist laravel/laravel blogStep 2: Setup Database
After successfully install laravel 8 Application, Go to your project .env file and set up database credential and move next step :
DB_CONNECTION=mysql
DB_HOST=127.0.0.1
DB_PORT=3306
DB_DATABASE=here your database name
DB_USERNAME=here database username
DB_PASSWORD=here database password
Step 3 : Add Route
first of all we will create simple route for creating simple line chart. so let's add simple routes as like bellow:
Path : routes/web.php
<?php
use App\Http\Controllers\HighChartController;
use Illuminate\Support\Facades\Route;

/*
|--------------------------------------------------------------------------
| Web Routes
|--------------------------------------------------------------------------
|
| Here is where you can register web routes for your application. These
| routes are loaded by the RouteServiceProvider within a group which
| contains the "web" middleware group. Now create something great!
|
*/

// HighChartController
Route::get('high-chart', [HighChartController::class, 'index']);
Step 4 : Create Controller
Here, we will create new controller as HighChartController. so let's add bellow code on that controller file.
Path : app\Http\Controllers\HighChartController
<?php
namespace App\Http\Controllers;

use Illuminate\Http\Request;
use App\Models\User;

class HighChartController extends Controller
{
    /**
     * Write Your Code..
     *
     * @return string
    */
    public function index()
    {
        $users = User::select(\DB::raw("COUNT(*) as count"))
                    ->whereYear('created_at', date('Y'))
                    ->groupBy(\DB::raw("Month(created_at)"))
                    ->pluck('count');

        return view('highChart', compact('users'));
    }
}
Step 5 : Create View file
here, we require to create blade file and in this blade file we use highchart js and use their code.
Path : resources/views/highChart.blade.php
<!DOCTYPE html>
<html>
<head>
    <title>Laravel 8 Highcharts Example - MyWebTuts.com</title>
    <link rel="stylesheet" href="https://cdnjs.cloudflare.com/ajax/libs/twitter-bootstrap/4.5.2/css/bootstrap.min.css" integrity="sha512-MoRNloxbStBcD8z3M/2BmnT+rg4IsMxPkXaGh2zD6LGNNFE80W3onsAhRcMAMrSoyWL9xD7Ert0men7vR8LUZg==" crossorigin="anonymous" />
</head>
<body>
    <div class="container mt-5">
        <h2 class="text-center"><strong>Laravel 8 Highcharts Example - MyWebTuts.com</strong></h2>
        <div id="hight-chart"></div>
    </div>
</body>
<script src="https://code.highcharts.com/highcharts.js"></script>
<script type="text/javascript">
    var users =  <?php echo json_encode($users) ?>;

    Highcharts.chart('hight-chart', {
        title: {
            text: 'New User Growth, 2021'
        },
        subtitle: {
            text: 'Source: MyWebTuts.com'
        },
         xAxis: {
            categories: ['Jan', 'Feb', 'Mar', 'Apr', 'May', 'Jun', 'Jul', 'Aug', 'Sep', 'Oct', 'Nov', 'Dec']
        },
        yAxis: {
            title: {
                text: 'Number of New Users'
            }
        },
        legend: {
            layout: 'vertical',
            align: 'right',
            verticalAlign: 'middle'
        },
        plotOptions: {
            series: {
                allowPointSelect: true
            }
        },
        series: [{
            name: 'New Users',
            data: users
        }],
        responsive: {
            rules: [{
                condition: {
                    maxWidth: 500
                },
                chartOptions: {
                    legend: {
                        layout: 'horizontal',
                        align: 'center',
                        verticalAlign: 'bottom'
                    }
                }
            }]
        }
});
</script>
</html>
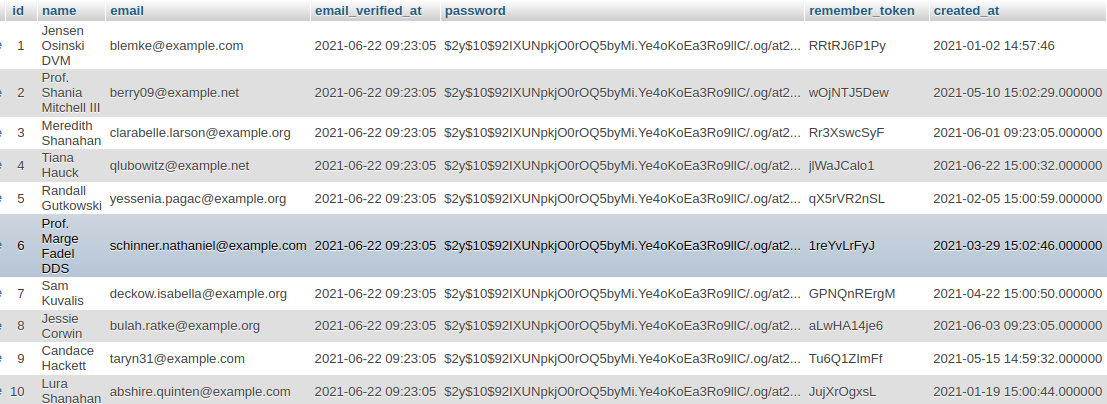
Step 6 : Create Dummy Records:
Here, we need to add some dummy records on users table as monthly wise. You require to create users on each month with created date as like bellow screen shot
 Step : 7 Run Your Project
Now we are ready to run our example so run bellow command for quick run:
php artisan serveNow you can open bellow URL on your browser:
http://localhost:8000/high-chart
It will help you.....