How to Use Charts.JS in Laravel 9?
Mar 19, 2022 . Admin
Hi dev,
Today, I am explian How to Use Charts.JS in Laravel 9?. Laravel 9 charts js example tutorial. In this laravel 9 charts js tutorial, we will show you how to implement a pie chart using a chart js in laravel 9 app. In this laravel 9 pie chart using charts js example tutorial i will show you how to implement pie chart using a chart js in laravel 9. In this tutorial you will learn to implement pie chart using a chart js in laravel 9 applications. In this example we will be using charts.js to implement pie chart in laravel 9 application.
The below example will be useful for us when we want to add charts on the server-side of Laravel. We will use our database to fetch the data, and after that, we will set that data in the Chart JS function.
Step 1: Download LaravelLet us begin the tutorial by installing a new laravel application. if you have already created the project, then skip following step.
composer create-project laravel/laravel example-appStep 2: Create Route
first of all we will create simple route for creating simple line chart. so let's add simple routes as like bellow:
routes/web.php
<?php

use Illuminate\Support\Facades\Route;

use App\Http\Controllers\ChartJSController;

/*
|--------------------------------------------------------------------------
| Web Routes
|--------------------------------------------------------------------------
|
| Here is where you can register web routes for your application. These
| routes are loaded by the RouteServiceProvider within a group which
| contains the "web" middleware group. Now create something great!
|
*/

Route::get('chart', [ChartJSController::class, 'index']);
Step 3: Create Controller
Here, we will create new controller as ChartJSController. so let's add bellow code on that controller file.
app/Http/Controllers/ChartJSController.php
<?php

namespace App\Http\Controllers;

use Illuminate\Http\Request;
use App\Models\User;
use DB;

class ChartJSController extends Controller
{
    /**
     * Write code on Method
     *
     * @return response()
     */
    public function index()
    {
        $users = User::select(DB::raw("COUNT(*) as count"), DB::raw("MONTHNAME(created_at) as month_name"))
                    ->whereYear('created_at', date('Y'))
                    ->groupBy(DB::raw("month_name"))
                    ->orderBy('id','ASC')
                    ->pluck('count', 'month_name');

        $labels = $users->keys();
        $data = $users->values();

        return view('chart', compact('labels', 'data'));
    }
}
Step 4: Create Blade File:
here, we need to create blade file and in this blade file we use highchart js and use their code.
resources/views/chart.blade.php
<!DOCTYPE html>
<html>
<head>
    <link href="https://fonts.googleapis.com/css2?family=Barlow:wght@200;300;400;500&family=Inter:wght@100;200;300;400;500;600;700;800;900&family=Kodchasan:ital,wght@0,300;1,200;1,300&family=Montserrat:ital,wght@0,200;0,300;0,800;1,200;1,300;1,400;1,500;1,600;1,700&family=Noto+Sans:ital,wght@0,400;0,700;1,400;1,700&family=Parisienne&family=Playball&family=Poppins:ital,wght@0,100;0,200;0,300;0,800;0,900;1,100;1,200;1,300&family=Roboto+Condensed:wght@300;400;700&family=Roboto+Mono:ital,wght@0,100;1,100&family=Roboto:ital,wght@0,100;0,300;1,100&family=Rubik+Beastly&family=Teko:wght@300;400;500;600;700&display=swap" rel="stylesheet">
    <title>How to Use Charts.JS in Laravel 9? - Mywebtuts.com</title>
</head>

<style type="text/css">
    body{
        font-family: 'Roboto Mono', monospace;
    }
    h1{
        text-align: center;
        font-size:35px;
        font-weight:900;
    }
</style>

<body>
    <h1>How to Use Charts.JS in Laravel 9? - Mywebtuts.com</h1>
    <canvas id="myChart" height="100px"></canvas>
</body>

<script src="https://cdnjs.cloudflare.com/ajax/libs/jquery/3.6.0/jquery.min.js" ></script>
<script src="https://cdn.jsdelivr.net/npm/chart.js"></script>

<script type="text/javascript">

    var labels =  {{ Js::from($labels) }};
    var users =  {{ Js::from($data) }};

    const data = {
        labels: labels,
        datasets: [{
            label: 'My First dataset',
            backgroundColor: 'rgb(255, 99, 132)',
            borderColor: 'rgb(255, 99, 132)',
            data: users,
        }]
    };

    const config = {
        type: 'line',
        data: data,
        options: {}
    };

    const myChart = new Chart(
        document.getElementById('myChart'),
        config
    );

</script>
</html>
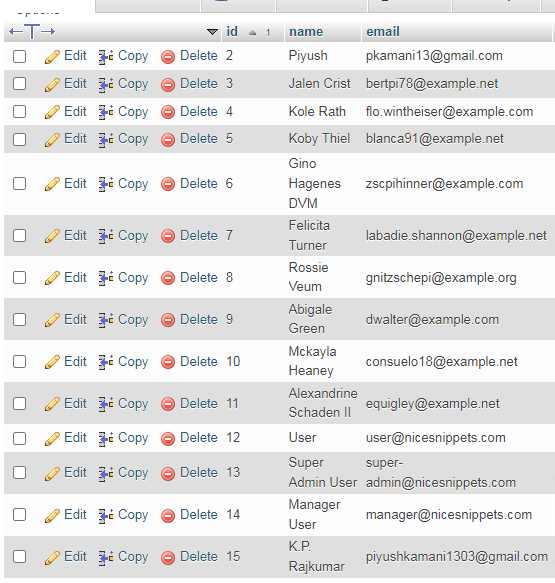
Step 5: Create Dummy Records:
Here, we need to add some dummy records on users table as monthly wise.
you can create dummy records using laravel tinker command as bellow:
php artisan tinker
User::factory()->count(30)->create()
You need to create users on each month with created date as like bellow screen shot:
All steps have been done, now you have to type the given command and hit enter to run the laravel app:
php artisan serve
Now, you have to open web browser, type the given URL and view the app output:
http://localhost:8000/chartOutput:
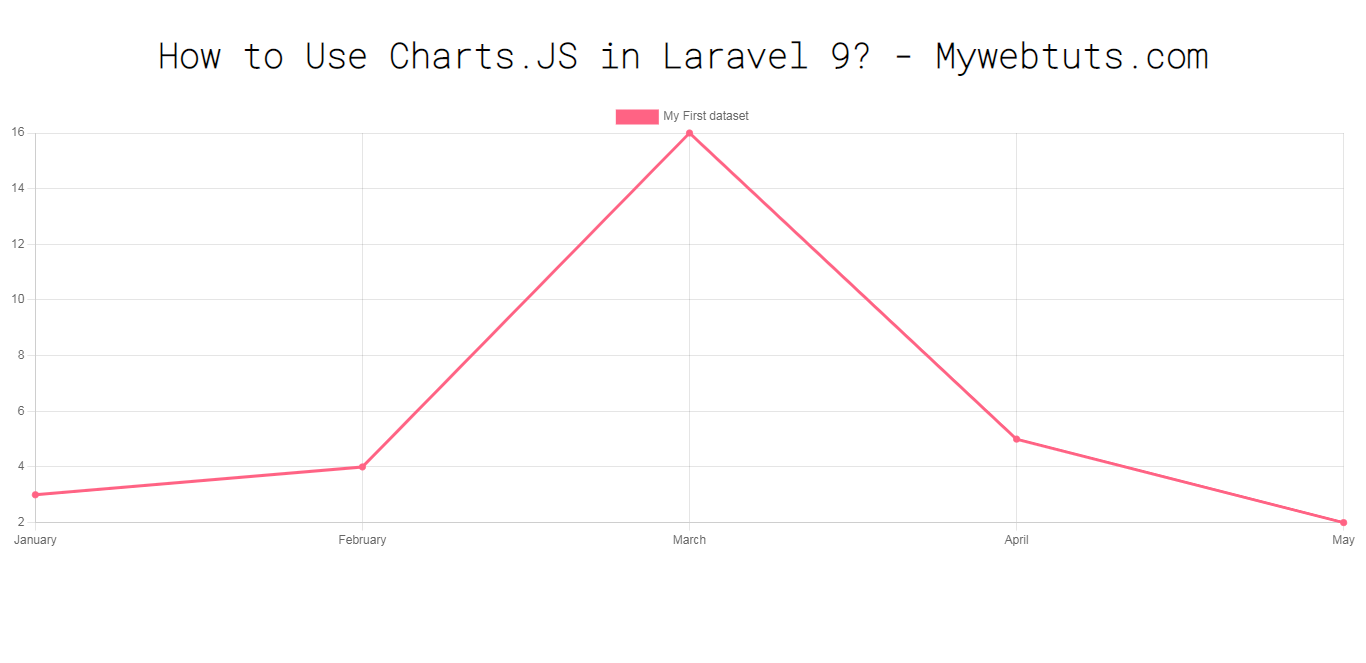
I hope it can help you...