React Native Chart Kit Progress Ring Example
May 29, 2021 . Admin

Hi Guys,
Today, I will learn you how to use chart kit progress ring in react native. we will show example of react native chart kit progress ring.You can easily create progress ring in react native. First i will import react-native-chart-kit and react-native-svg, after I will create chart kit progress ring in react native.
Here, I will give you full example for simply display chart kit progress ring using react native as bellow.
Step 1 - Create projectIn the first step Run the following command for create project.
expo init ChartProjectStep 2 - Install Package
In the step,I will install yarn add react-native-chart-kit package.
yarn add react-native-chart-kitAfter,I will install yarn add react-native-svg package.
yarn add react-native-svgStep 3 - App.js
In this step, You will open App.js file and put the code.
import React, { Component } from "react";
import {View,StyleSheet,Text,Dimensions} from 'react-native';
import { Provider,Appbar} from 'react-native-paper';
import {ProgressChart} from "react-native-chart-kit";

const MyWebtutsComponent = () => {

  const data = {
    labels: ["Laravel", "PHP", "html",'javascript'], // optional
    data: [0.4, 0.7, 0.8,0.4]
  };

  const _goBack = () => console.log('Went back');

  const _handleSearch = () => console.log('Searching');

  const _handleMore = () => console.log('Shown more');

  return (
    <Provider>
    <Appbar.Header style={styles.header}>
      <Appbar.BackAction onPress={_goBack} />
      <Appbar.Content title="My App" subtitle="Subtitle" />
      <Appbar.Action icon="magnify" onPress={_handleSearch} />
      <Appbar.Action icon="dots-vertical" onPress={_handleMore} />
    </Appbar.Header>
      <View style={styles.mainbox}>
        <Text style={styles.title}>React Native Progress Ring Example - MyWebtuts.com</Text>
        <ProgressChart
          data={data}
          width={340}
          height={220}
          strokeWidth={16}
          radius={32}
           chartConfig={{
            backgroundColor: "#218838",
            backgroundGradientFrom: "#fff",
            backgroundGradientTo: "#e2e2e2",
            decimalPlaces: 2, // optional, defaults to 2dp
            color: (opacity = 1) => `rgba(13, 136, 56, ${opacity})`,
            labelColor: (opacity = 1) => `rgba(0, 0,0, ${opacity})`,
            style: {
              borderRadius: 16
            },
            propsForDots: {
              r: "6",
              strokeWidth: "2",
              stroke: "#218838"
            }
          }}
          style={{
            marginVertical: 8,
            borderRadius: 16
          }}
          hideLegend={false}
        />
      </View>
    </Provider>
  );
};


const styles = StyleSheet.create({
  title:{
    fontSize: 20,
    textAlign:'center',
  },
  mainbox:{
    textAlign:'center',
    margin: 15,
    justifyContent: 'space-between',
  },
});
export default MyWebtutsComponent;
Step 4 - Run project
In the last step run your project using bellow command.
expo startOutput
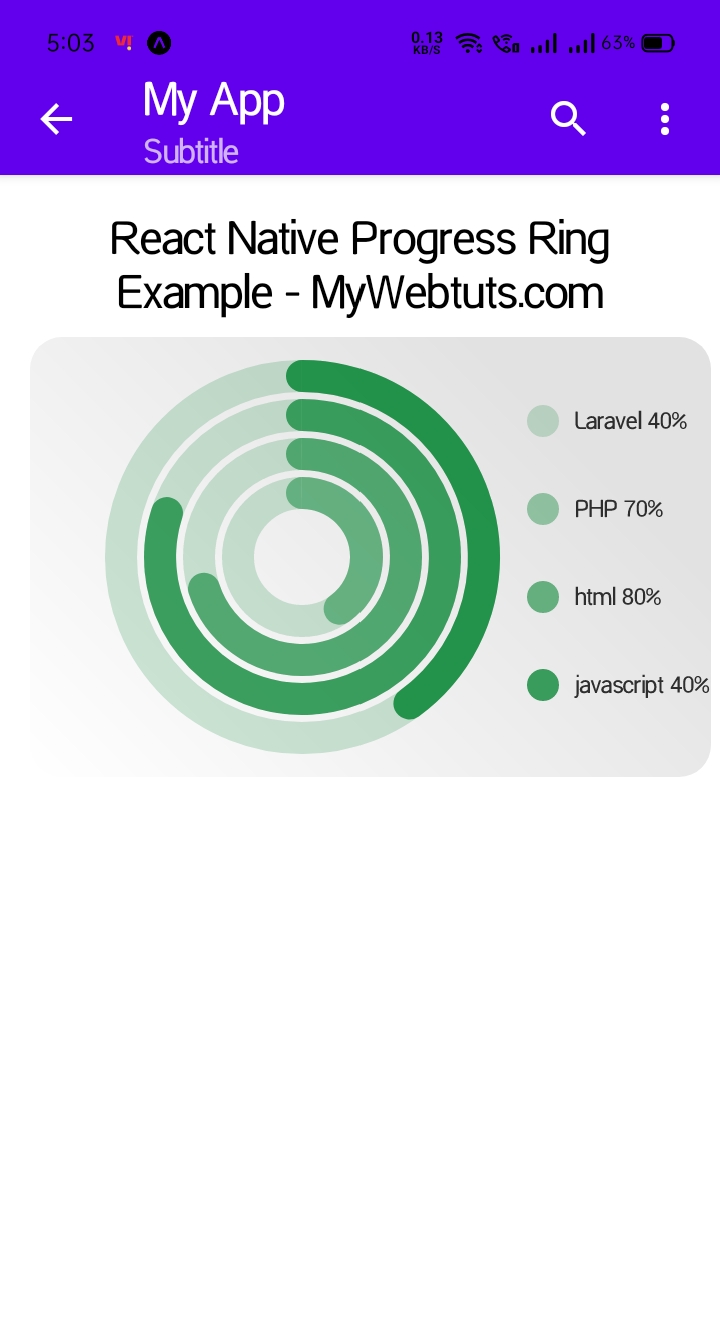
It will help you..